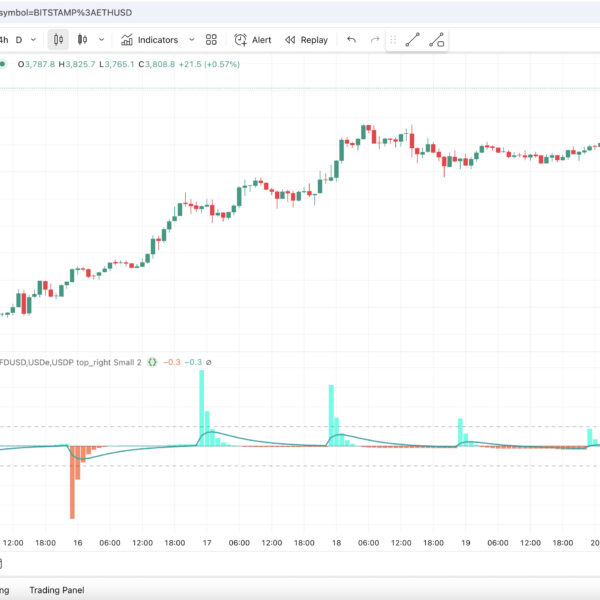
Stablecoin Supply Pulse (SSP) gives you a clear, data-driven view of how the big dollar-pegged tokens expand or shrink each day. It pulls market-cap or on-chain supply for up to six stablecoins, turns the daily change into a Z-Score, and plots an easy-to-read histogram. Because the code works on any chart, you can keep an eye on the health of crypto liquidity without switching tabs.
Why Stablecoin Supply Pulse Matters
-
Tracks Liquidity in Real Time
A rising SSP Z-Score signals fresh capital; meanwhile, a deep negative score warns that stable money is leaving the market. -
Adaptive Statistics
The script widens or tightens its lookback automatically, so extreme readings stay trustworthy during both calm and wild months. -
Market-Cap or Supply Mode
Toggle between circulating supply and dollar market-cap with one click, therefore matching the dataset to your thesis. -
Total-Crypto Normalisation
Optionally, express the daily change as a share of total crypto market-cap. As a result, you see whether stablecoin flows move the whole space. -
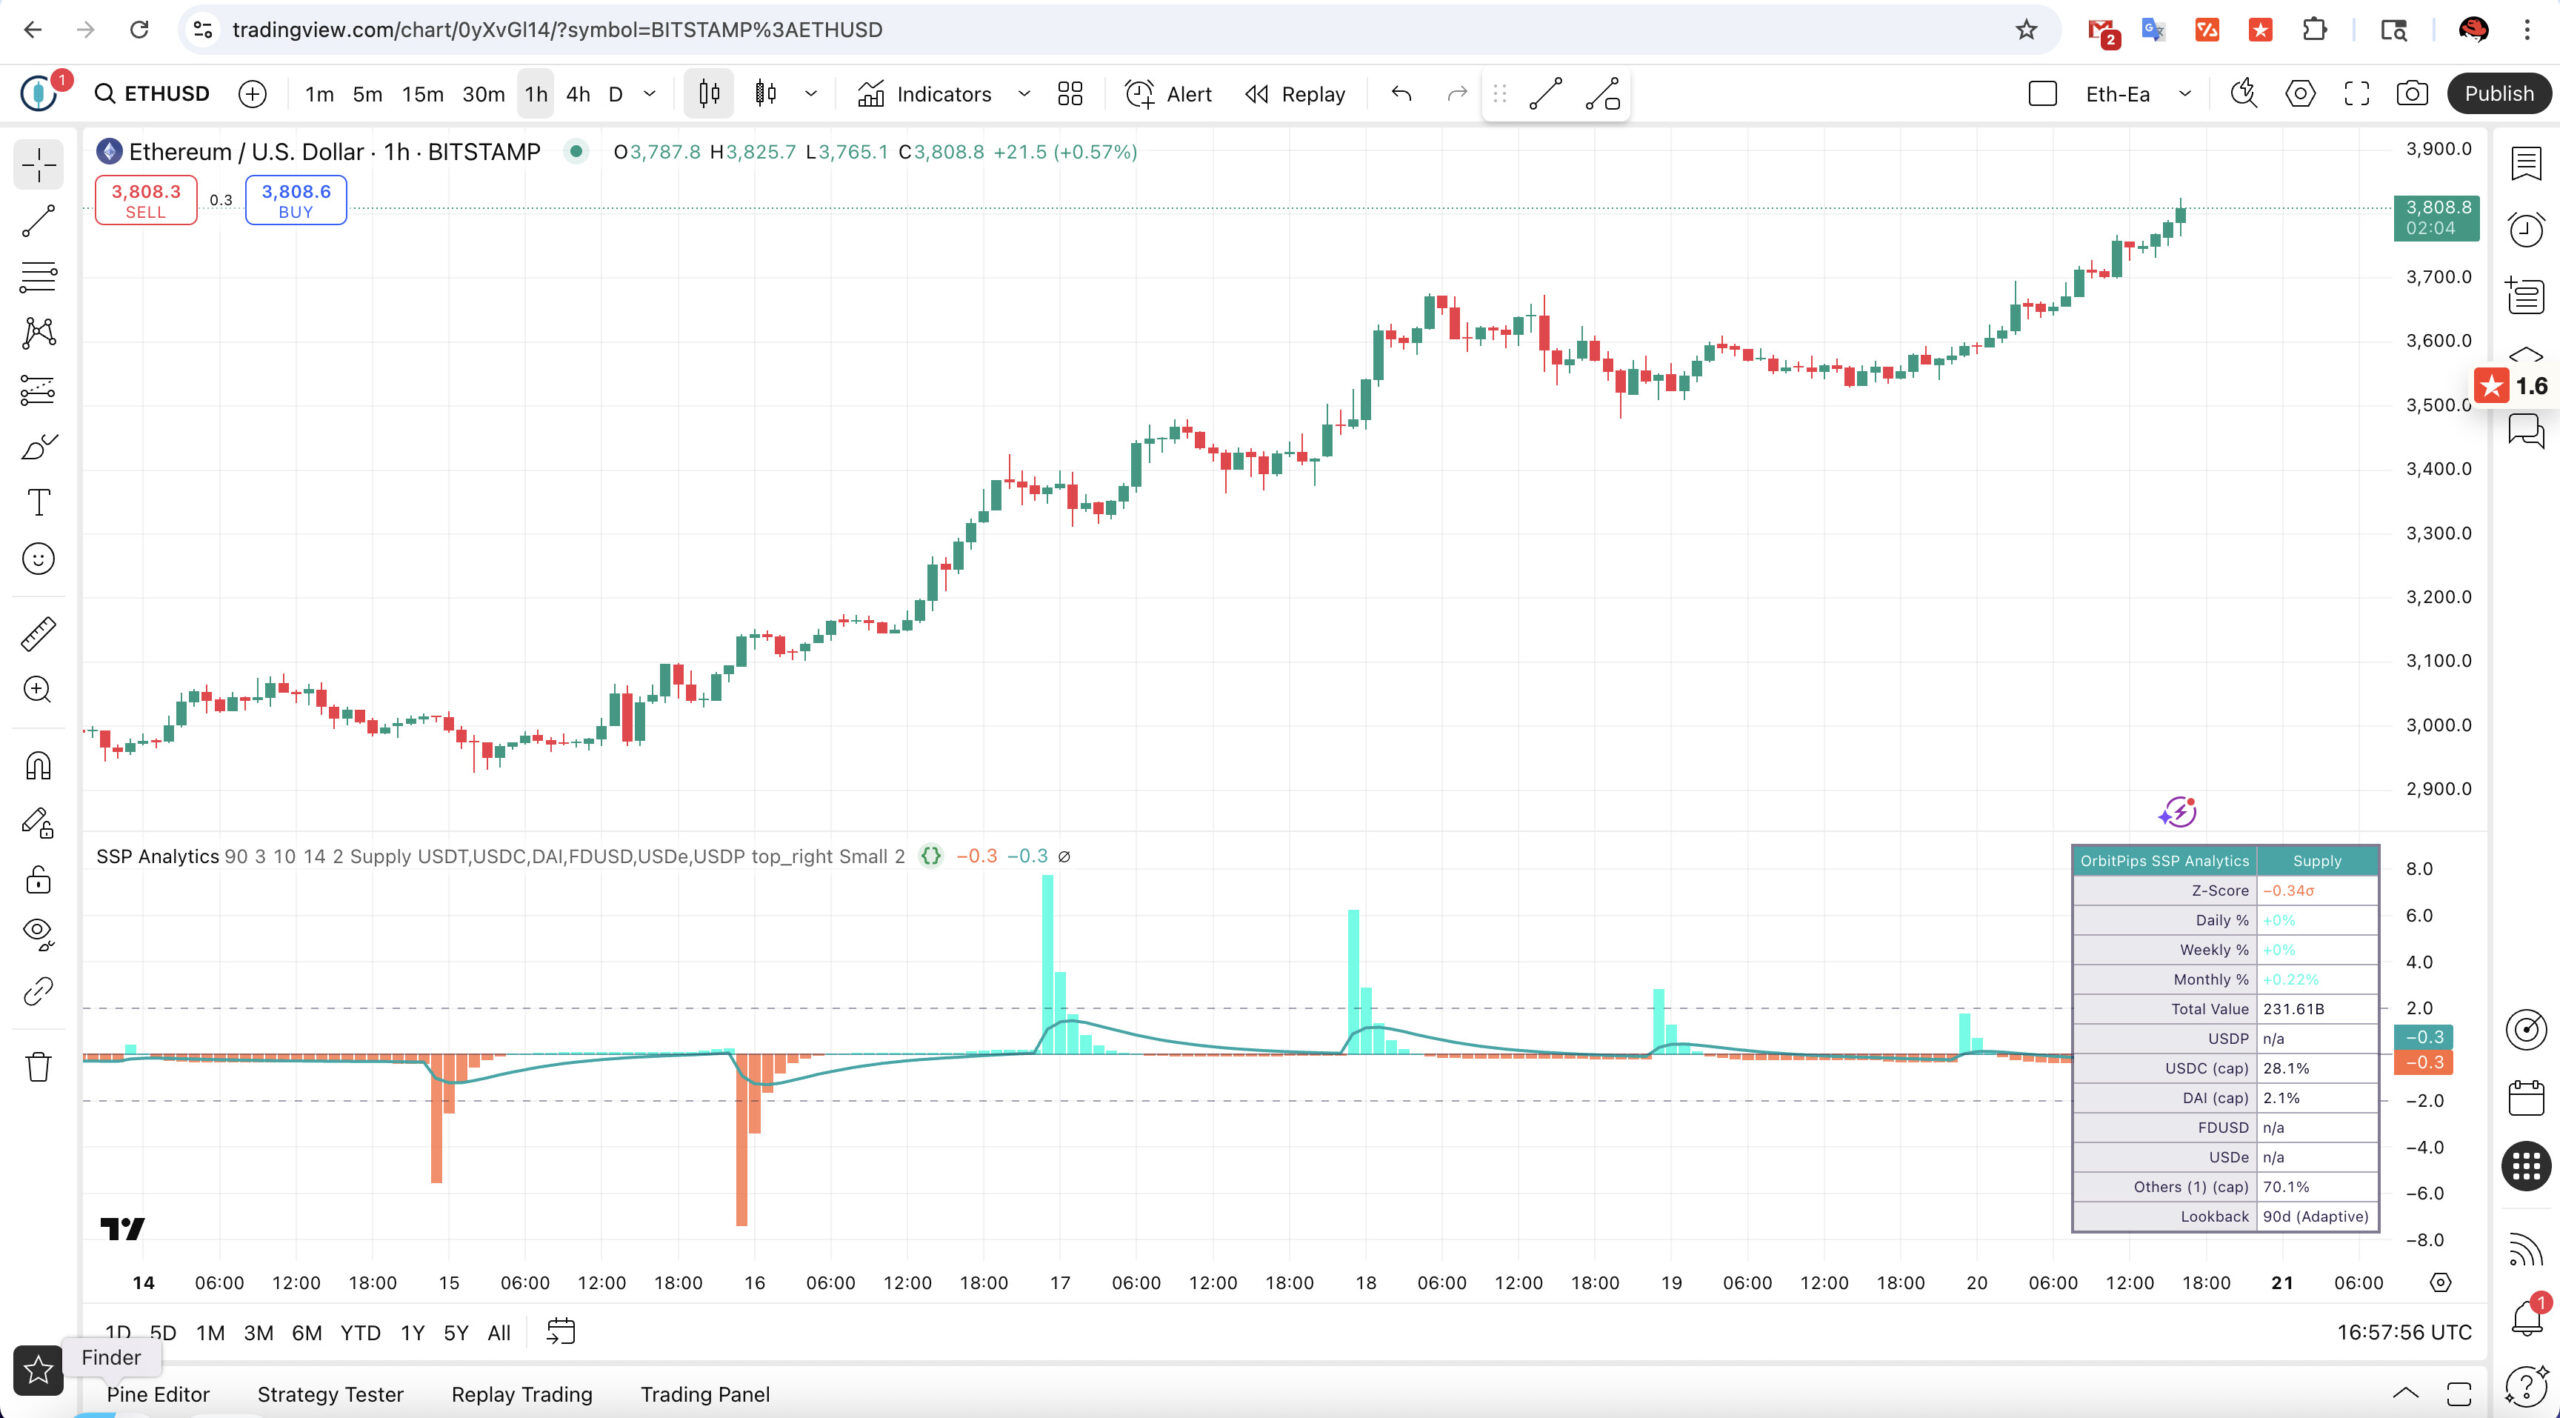
Instant Breakdown Table
A colour-coded dashboard lists the top five coins, an “Others” bucket, daily/weekly/monthly changes, and the live Stable-to-Crypto ratio.
Key Features at a Glance
| Feature | Detail |
|---|---|
| Supported Coins | USDT, USDC, DAI, FDUSD, USDe, USDP (editable) |
| Data Sources | CRYPTOCAP: & SUPPLY: feeds |
| Core Signal | Z-Score of daily % change, EMA-smoothed |
| Reference Lines | 0, ±2 σ by default |
| Trend Filter | Optional EMA on the Z-Score |
| Table Modes | Compact or verbose; four corner positions |
| Visual Theme | OrbitPips neon palette |
How to Read the Stablecoin Supply Pulse
-
Z-Score Histogram
• Bars above +2 σ = aggressive inflows → liquidity tail-wind.
• Bars below –2 σ = heavy outflows → potential risk-off. -
Trend Line
When the teal EMA rises through zero, the stablecoin base expands on trend. Conversely, a drop below zero flags contraction. -
Analytics Table
Check which coin drives the move. For instance, if USDT grows while USDC shrinks, sentiment favours one issuer over another. -
Pulse Line (Optional)
Enable “Pulse Lines” to mark double-threshold events (> ±4 σ). Use them as heads-up signals for possible volatility.
Typical Workflows
• Swing Traders — Gauge whether fresh cash backs your breakout setup.
• Macro Analysts — Add SSP to weekly dashboards for an at-a-glance liquidity metric.
• DeFi Treasuries — Monitor stable diversification and rotate holdings when dominance shifts.
• Risk Desks — Set alerts for sudden multi-sigma drains that may precede market stress.
Quick Setup
- Add Stablecoin Supply Pulse to any TradingView chart.
- Pick Market Cap or Supply in the settings.
- (Optional) Turn on normalisation to view changes relative to total crypto size.
- Place the dashboard in your preferred corner and choose compact mode for minimal screen real estate.
Add Stablecoin Supply Pulse to your toolkit today, and stay ahead of the next liquidity wave.

)
1 review for Stablecoin Supply Pulse (SSP)
There are no reviews yet.