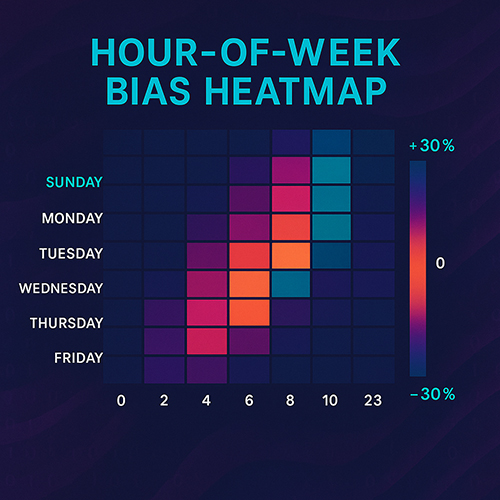
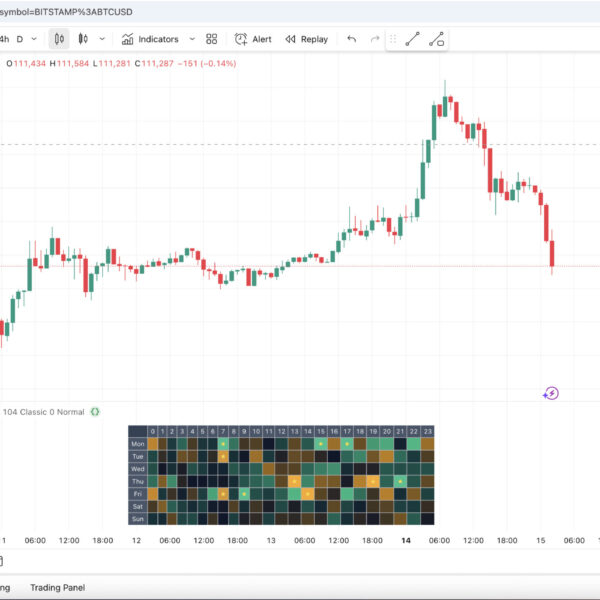
Hour-of-Week Bias Heatmap is your 7 × 24 liquidity radar for crypto and forex. Although markets trade nonstop, edge appears at very specific times. Therefore, this indicator reveals—at a glance—how each of the 168 hours in a week has behaved during the last 104 weeks, so you can align entries and exits with the statistically most favourable windows.
Why this indicator matters
- Markets are open 24/7; however, volume and drift are not evenly spread.
- Because HWBH reveals hidden “golden hours,” you finally know when price tends to trend.
- Moreover, the two-year look-back smooths noise, so you trade a real bias, not intuition.
How it works, step by step
- First, every closed bar’s log-return is written to one of 168 hourly buckets.
- Next, you may choose cumulative mode or, alternatively, a rolling FIFO window of N weeks.
- After that, values are normalised to the optional 95th percentile, thus keeping BTC and small-caps comparable.
- Meanwhile, a smart palette—Classic, Solana, or Minimal—maps gains to green and losses to red.
- Finally, tool-tips display day, hour, bias %, and sample size, while yellow stars highlight the five best and five worst hours.
Key features at a glance
| Feature | Benefit |
|---|---|
| 7 × 24 heatmap | Therefore, you visualise an entire week of drift in one grid. |
| Three colour themes | Consequently, the tool fits any chart style. |
| Adjustable fonts | Likewise, Small, Normal, or Large suit every monitor. |
| Time-zone offset | As a result, your desk clock and the heatmap stay in sync. |
| Star highlight | Thus, the strongest edges pop instantly. |
| Timeframe guard | In contrast, charts <1 H or >4 H trigger a yellow warning banner. |
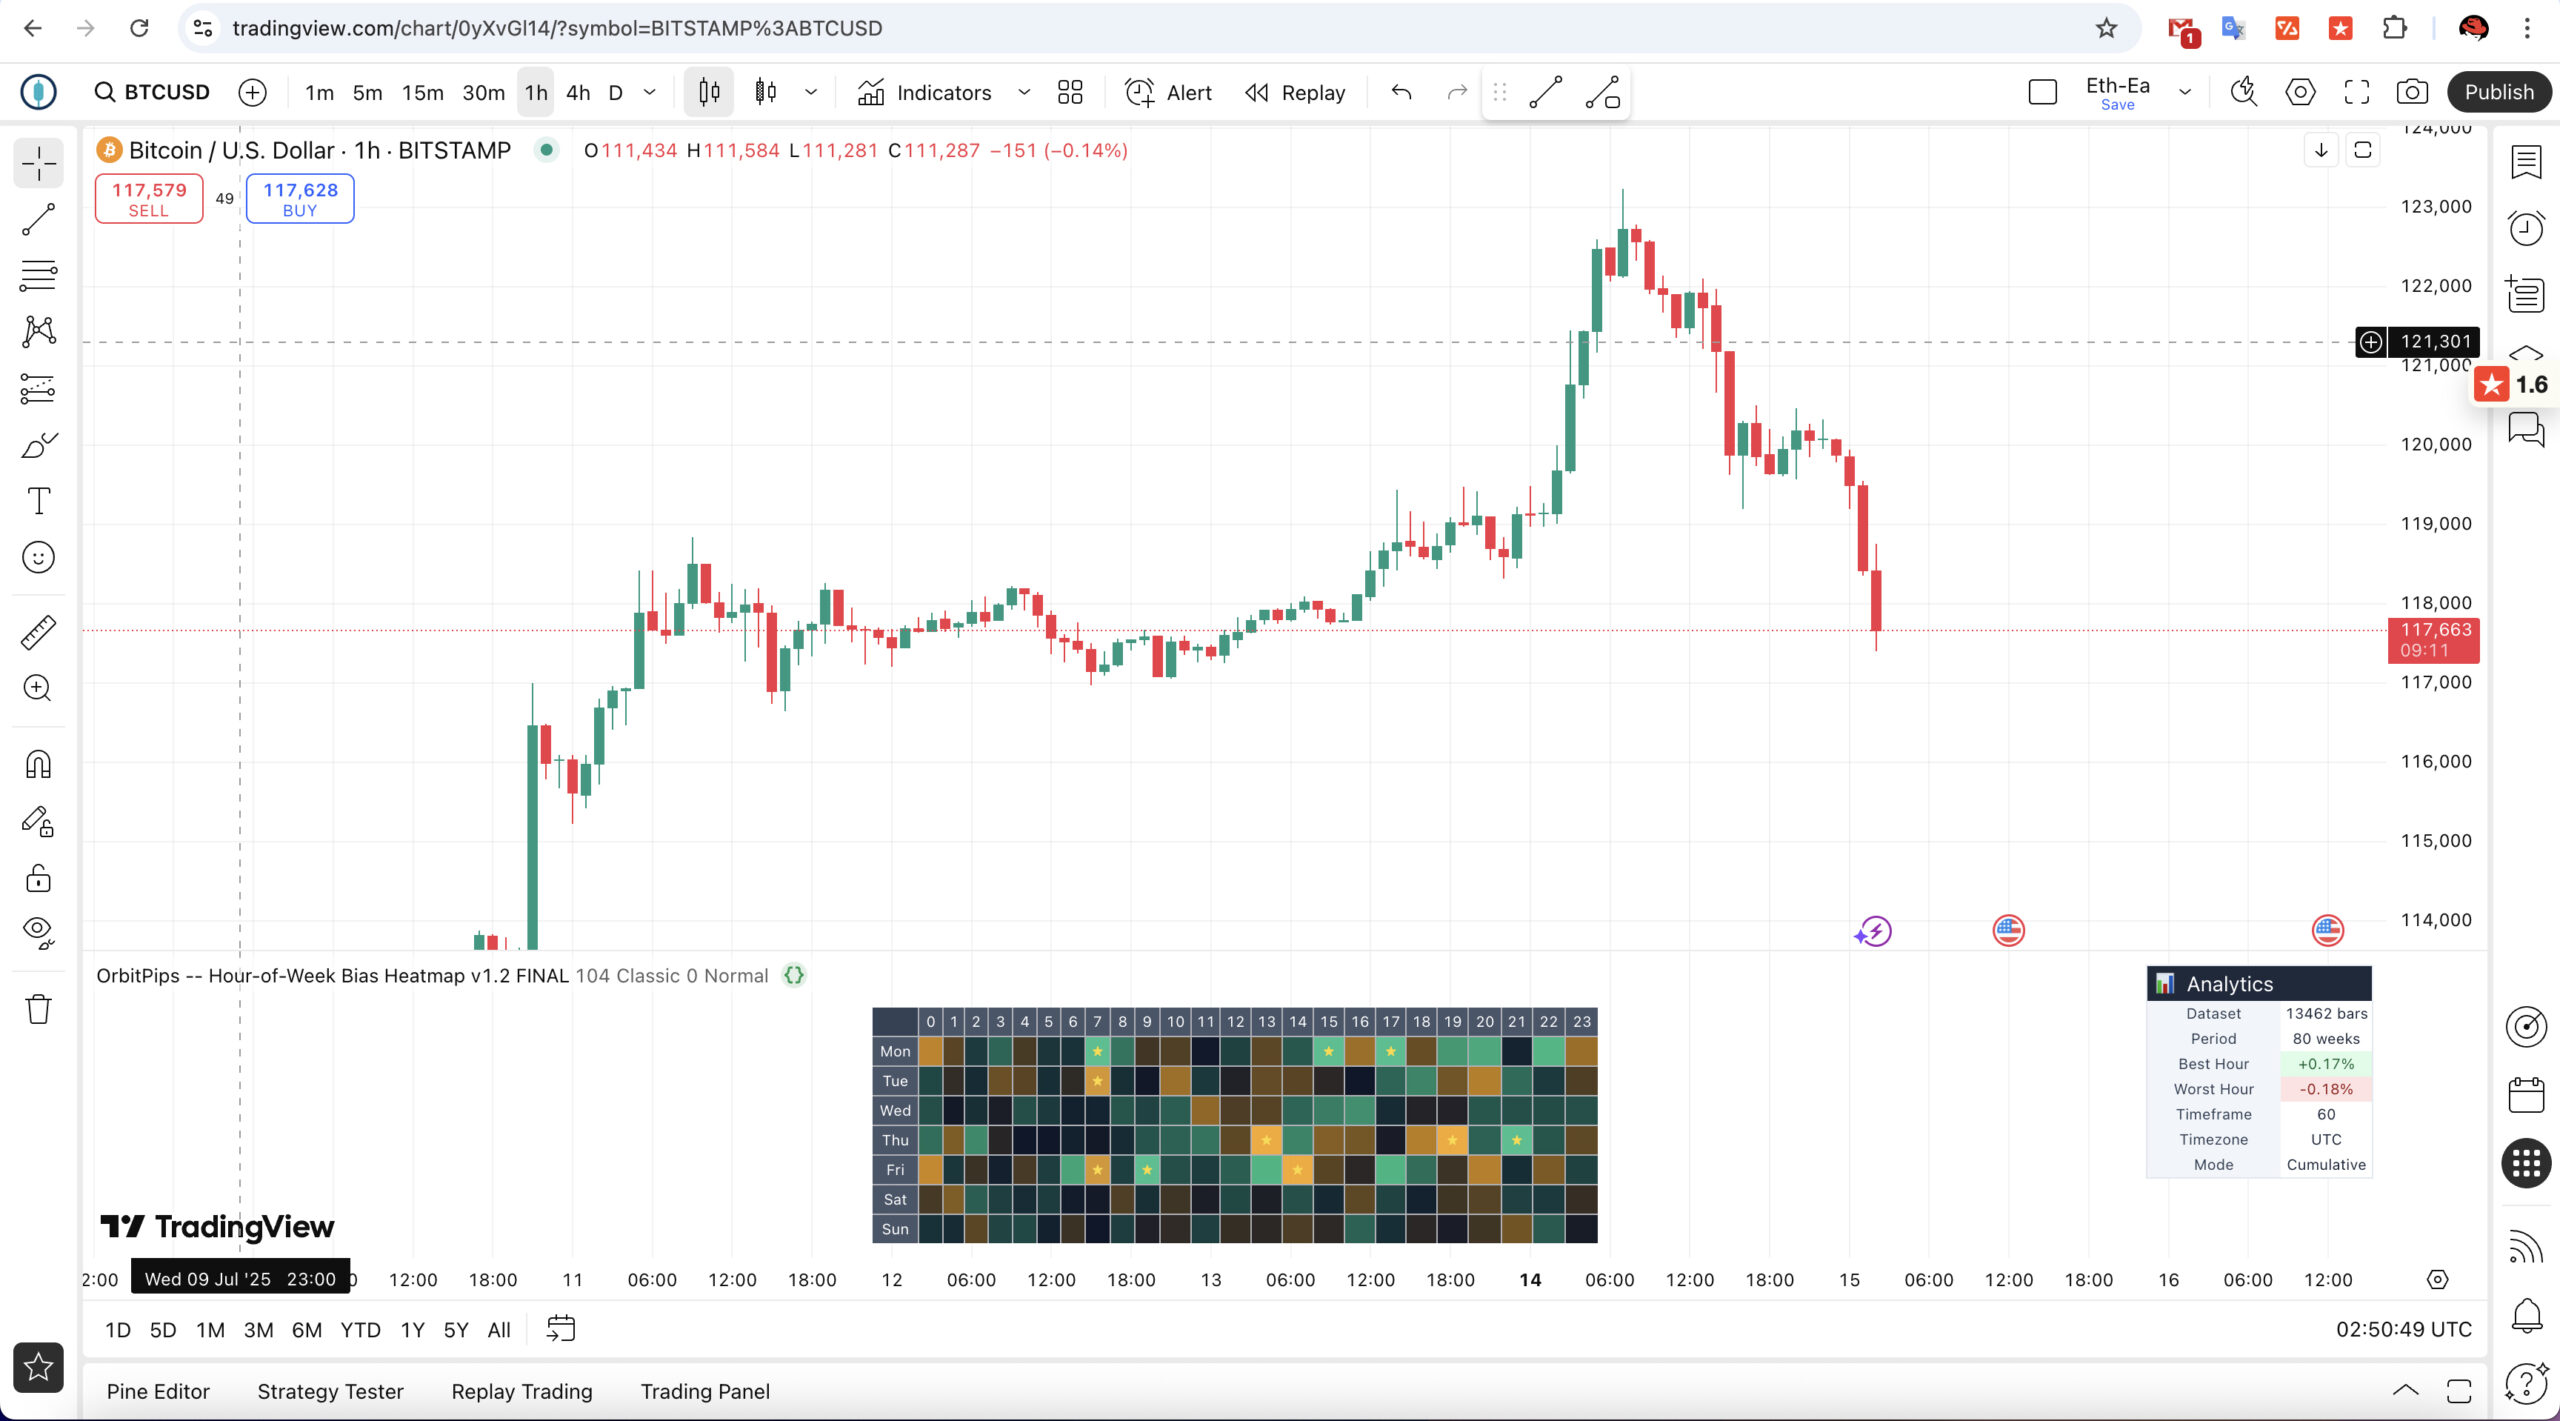
| Analytics panel | Furthermore, you see total bars, look-back weeks, and extreme bias values. |
| Pine v6 optimised | Hence, even busy layouts remain smooth. |
Quick Start with the Hour-of-Week Bias Heatmap on TradingView
- Install the script → Indicators → search “Hour-of-Week Bias Heatmap” → add to chart.
- Select a valid timeframe → use 1 H, 2 H, or 4 H; otherwise, a warning appears.
- Adjust look-back → for newly listed symbols, simply reduce weeks from 104 to, for instance, 26.
- Pick colours & fonts → meanwhile, switch palettes with one click.
- Apply time-zone offset → for example, enter +8 for Singapore or −5 for New York.
Trading Strategies Using the Hour-of-Week Bias Heatmap
- London breakout filter – If Monday 08-09 UTC is deep green, then long setups gain extra conviction.
- Sunday slippage avoidance – Conversely, red late-Sunday cells warn of wide spreads.
- Session stacking – Moreover, combine a bullish hour with high-volume opens for compound edge.
- Overnight mean reversion – Likewise, short hours showing negative bias right after extreme positive bias.
FAQ About the Hour-of-Week Bias Heatmap Indicator
Is it free?
Yes. In fact, the Hour-of-Week Bias Heatmap TradingView Indicator is 100 % free and open-source.
Why not 30-minute candles?
Because half-hour data double-counts returns; therefore, stick to 1 H–4 H.
Does it work on stocks or forex?
Certainly—any continuously traded symbol. However, for equities you may prefer a 24/5 CFD.
Can I change colours?
Of course. Either pick another preset or fork the code.
Installation details
Path: Indicators & Strategies → “Hour-of-Week Bias Heatmap”
⭐  Click the star to save it in Favourites.
🕒  Load on a 1 H chart; otherwise you will see a yellow timeframe warning.

1 review for Hour-of-Week Bias Heatmap
There are no reviews yet.