Know which side of today’s market is most likely to break—before it happens.
SRB analyzes up to 180 days of historical session ranges and shows, at a glance, the probability that today’s high or low will be breached.
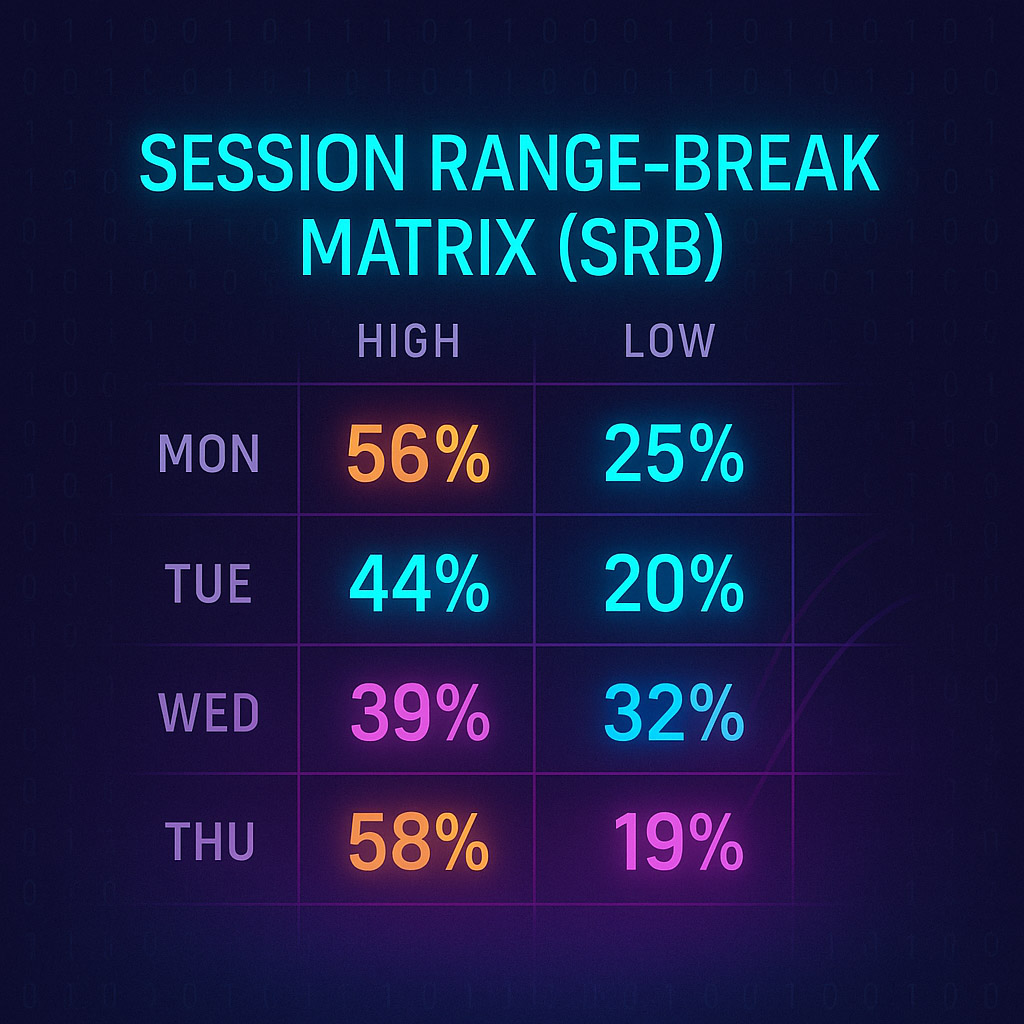
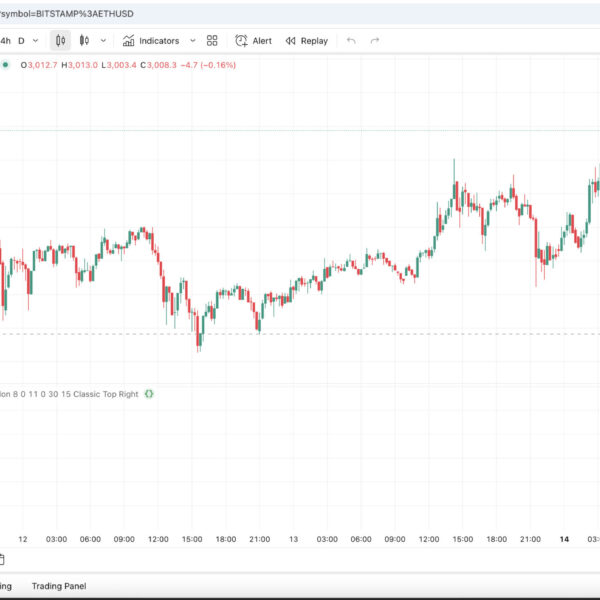
Session Range-Break Matrix TradingView indicator (SRB) instantly tells you how often today’s session high or low is likely to break, based on 10-to-180 days of historical data for London, New York, or Asia. With its color-coded heat-map and real-time alerts, SRB turns raw price action into clear breakout probabilities you can trade with confidence.
Key Benefits
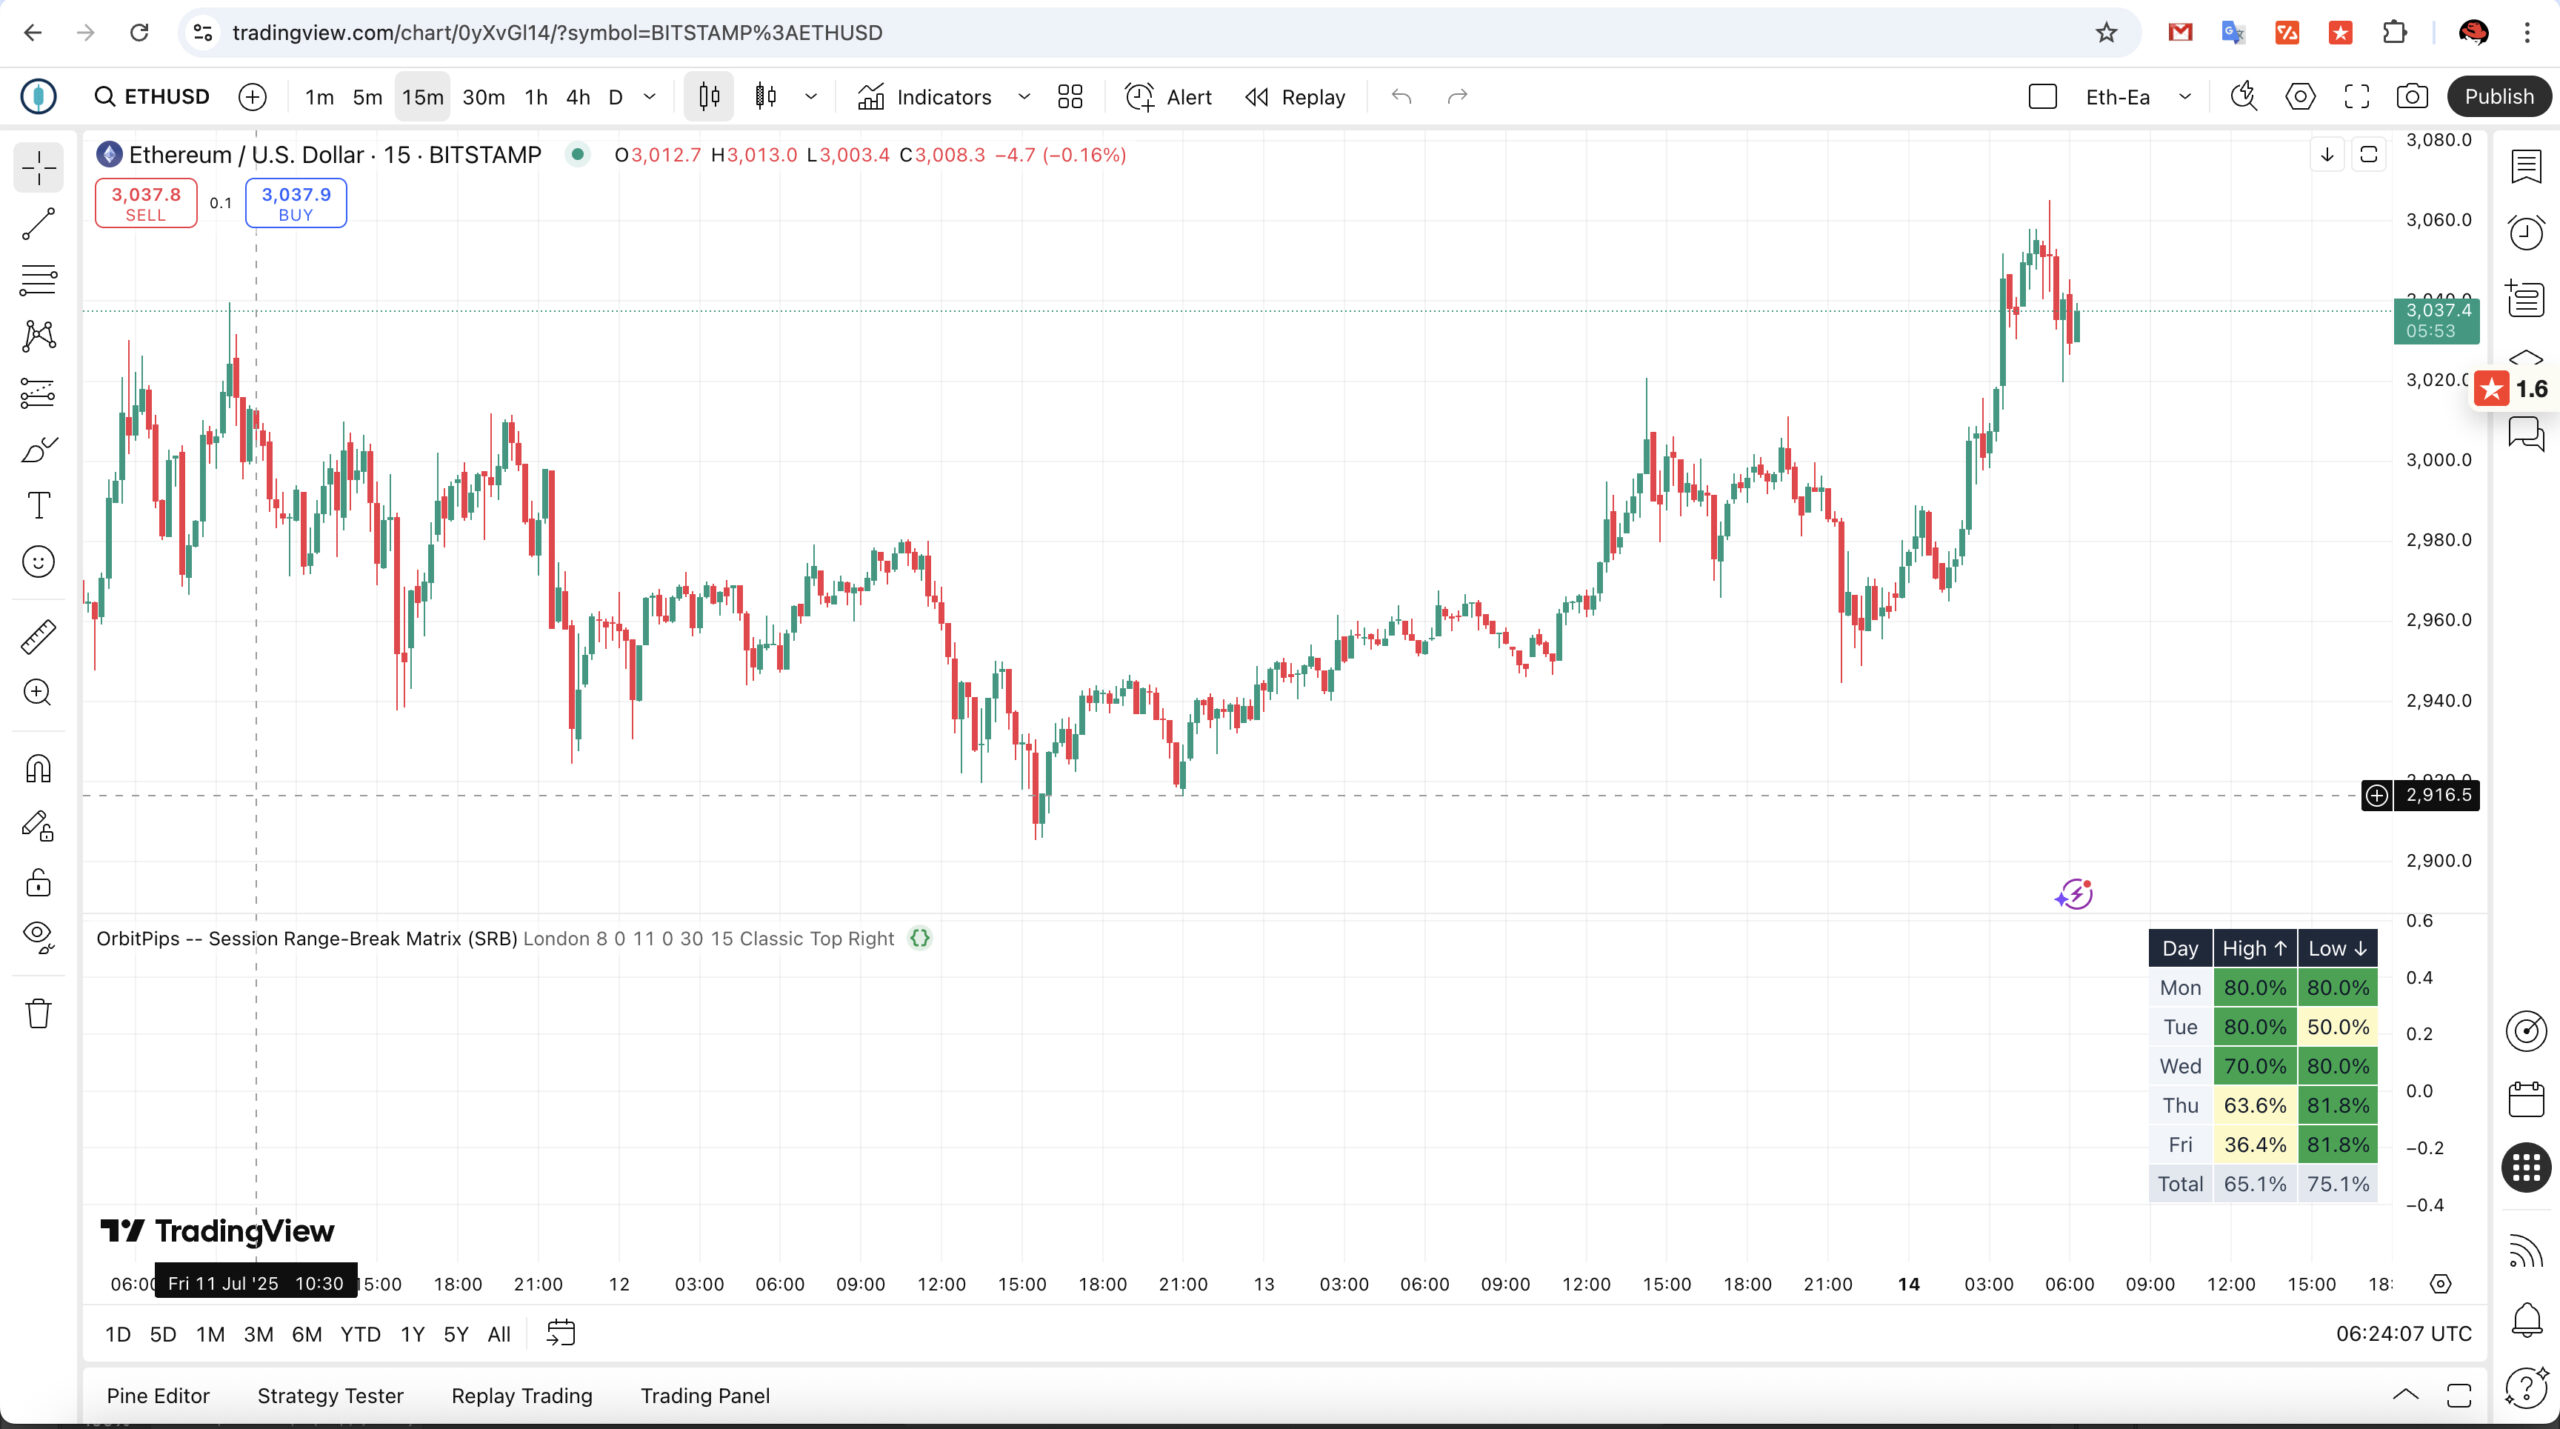
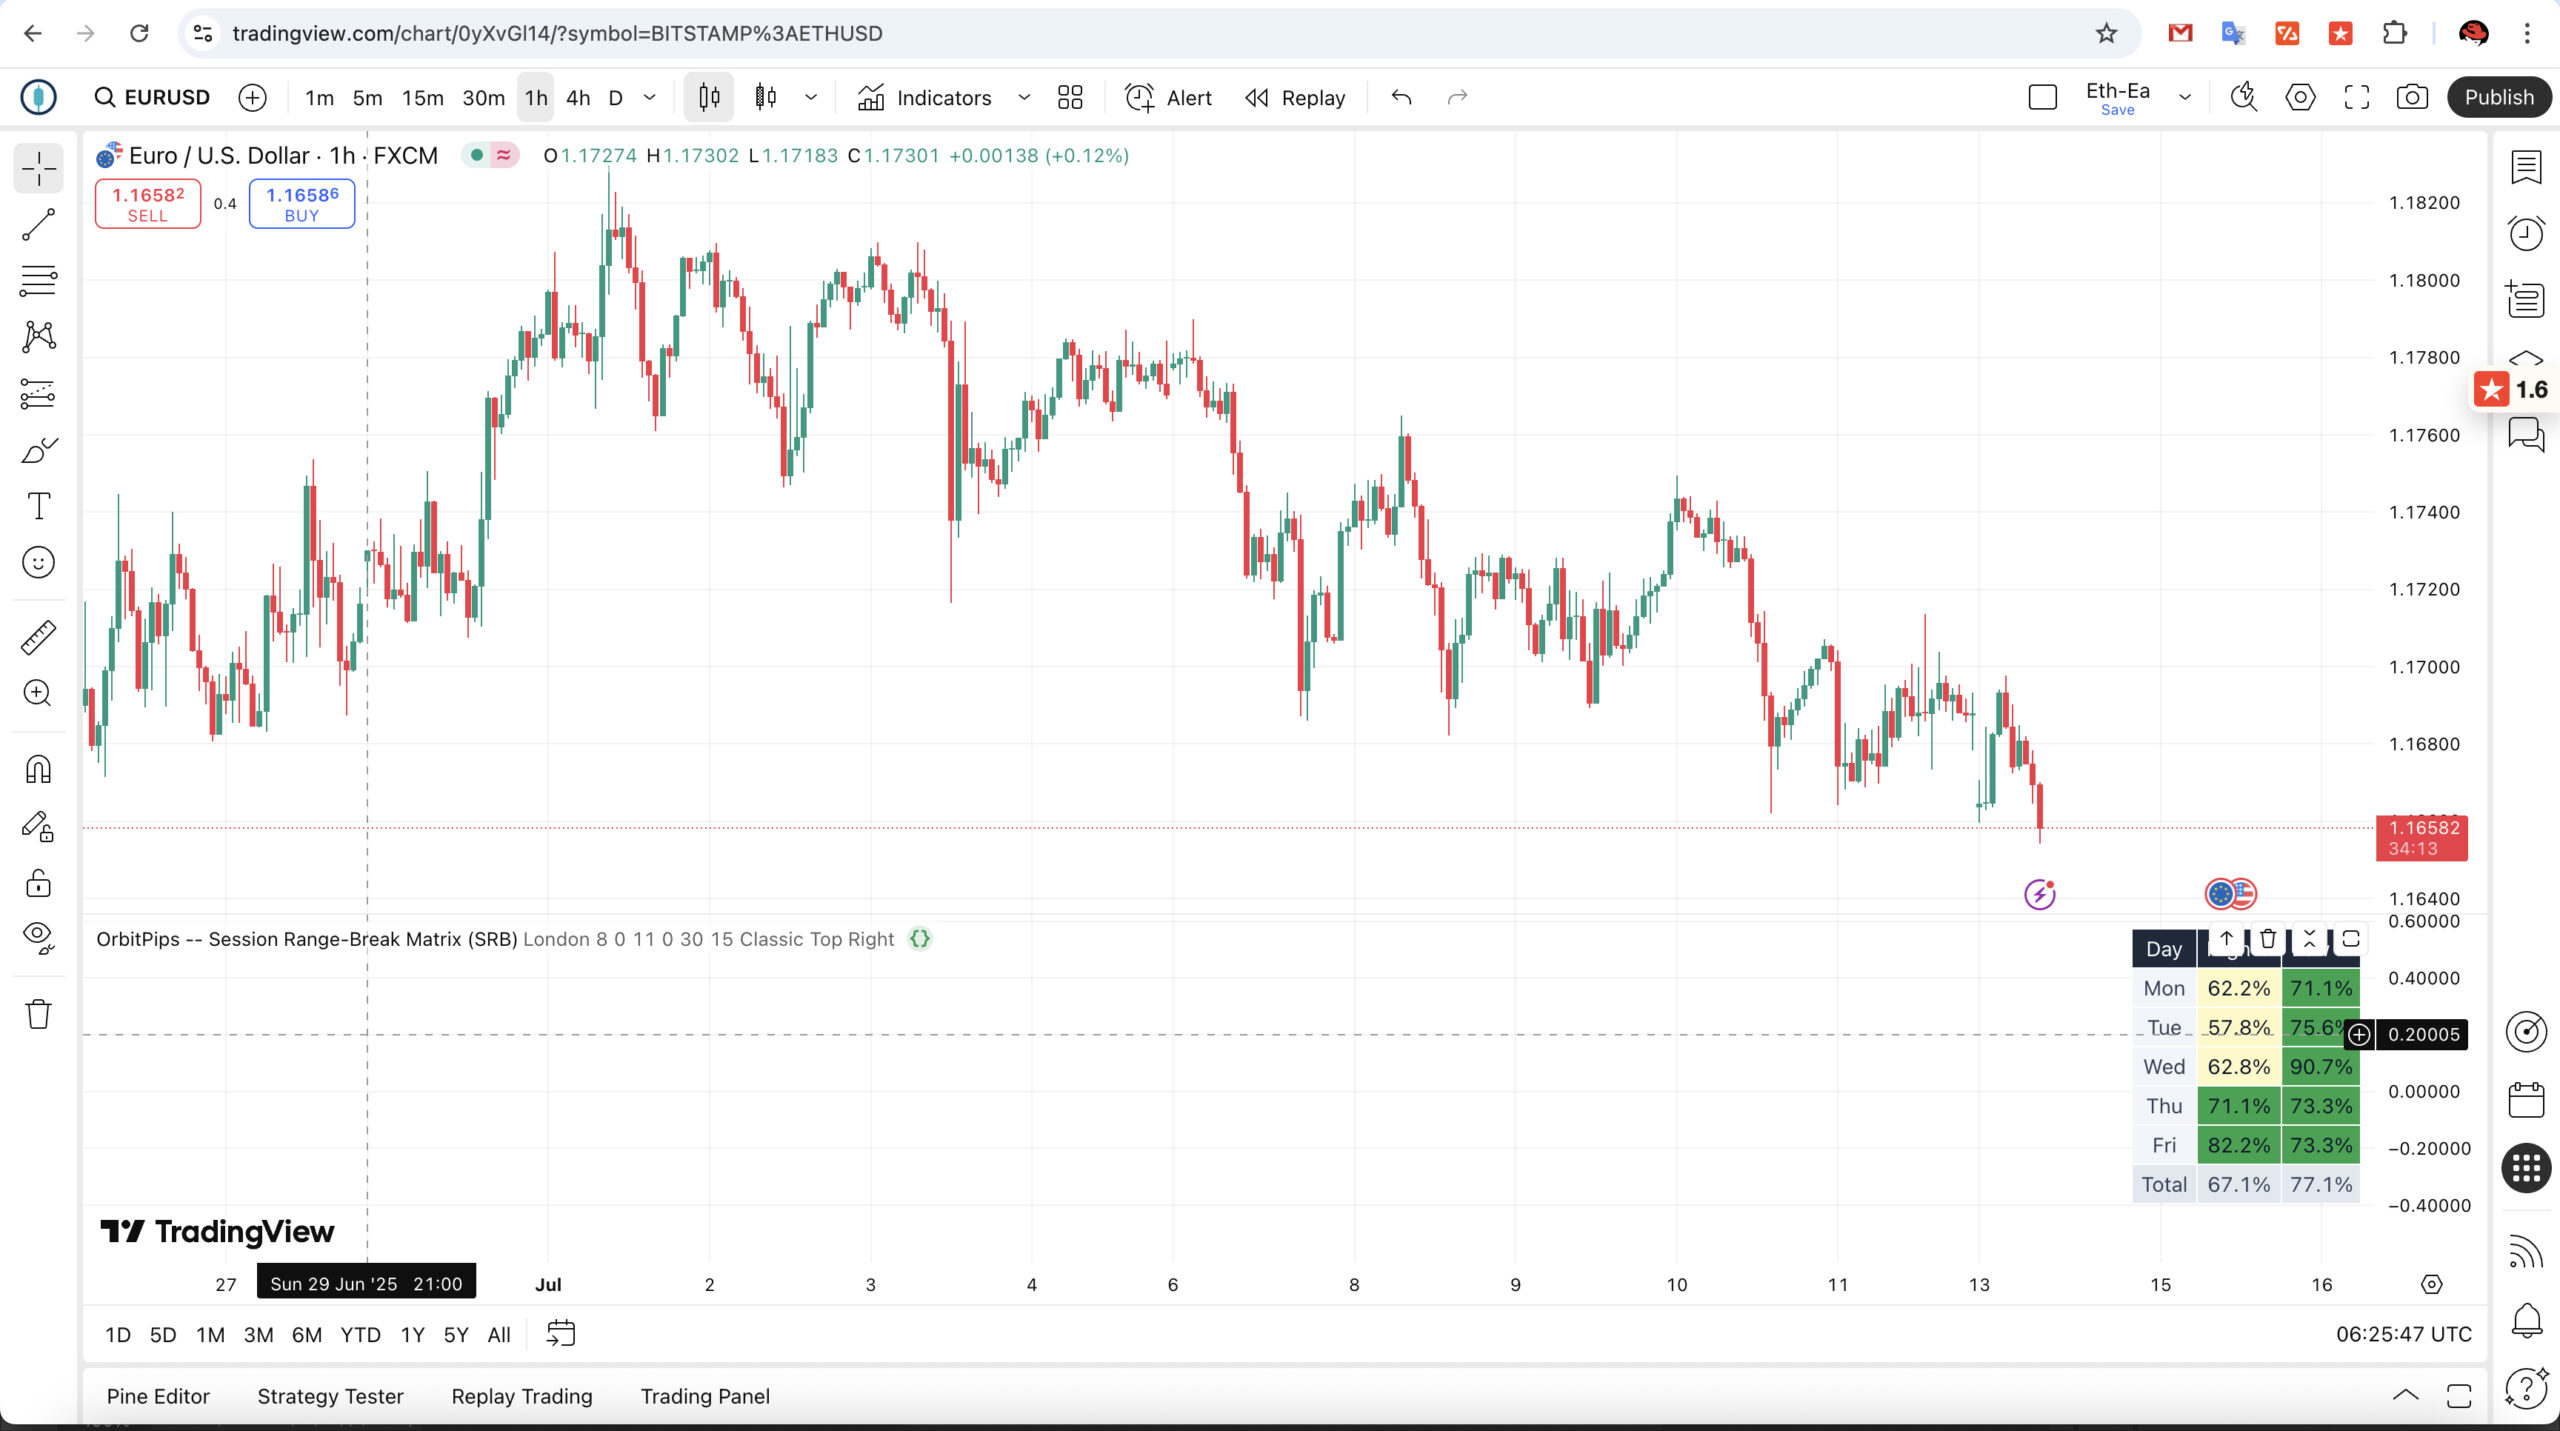
• Day-of-week heat-map with classic color coding (green ≥ 70 %, yellow 30–70 %, red ≤ 30 %).
• Three built-in presets—London, New York, Asia—plus a fully custom session window.
• Smart alerts:
– “Break Expected” when probability ≥ 70 % and price hasn’t broken yet.
– “Break Confirmed” the moment the range is breached.
• Zero repainting—calculations use only closed data.
• Lightweight (max_bars_back = 5 000) and runs on your current chart.
Overview:
First, the Session Range-Break Matrix distills explosive post-session moves into pure statistics. By tracking each session’s high and low on a user-defined timeframe (default 15 m) and then comparing them against the past n days, SRB consequently reveals how often those extremes were broken later in the day. As a result, the indicator produces a color-coded dashboard—for example, “72 % of Fridays break the London low.” Furthermore, you can overlay the script on any TradingView chart, turn on push notifications, and validate your fade or breakout strategy with real probabilities—no external data, no latency. In contrast to standard range-break indicators, Session Range-Break Matrix TradingView calculates breakout probabilities separately for the London, New York, and Asia sessions; therefore, you see at a glance which session is statistically primed for a break.
Technical Specifications
| Field | Value |
|---|---|
| Platform | TradingView (Pine Script v6) |
| Recommended markets | Forex majors, Gold, Crypto |
| Calculation timeframe | User selectable, default 15 m |
| Presets | London 08:00-11:00, NY 13:30-16:30, Asia 00:00-03:00 (UTC) |
| Look-back window | 10–180 days (default 30) |
| Current version | 1.0.1 – 2024-07-14 |
| Code size | ~200 lines Pine |
| Free-edition limits | one chart at a time |
| Repainting | None |
Installation & Setup:
- First, open TradingView and click Indicators on the top toolbar.
- Next, in the search bar, type “Session Range-Break Matrix” or “OrbitPips SRB.”
- Then, click the script that appears under Community Scripts.
- After that, press Add to Chart; the heat-map table will appear automatically.
- Finally, to receive alerts (optional):
• Right-click the chart → Add Alert → Condition: SRB → “Any alert.”
• Set the frequency to Once Per Bar and enable push or email notifications.
Therefore, that’s it—no invite or payment required.
Trading Use-Cases:
Breakout scenario
On Thursdays, the London high is broken 76 % of the time. During NY open the high is still intact—place a buy-stop above the range.
Mean-reversion scenario
Tuesdays show only an 18 % chance of breaking the session low. If price approaches that low, favor a bounce instead of chasing a breakout.
Frequently Asked Questions (FAQ)
1. Does SRB work on crypto, indices, or commodities?
Yes. SRB is market-agnostic and will analyze any symbol you can load on TradingView—forex pairs, stock indices, cryptocurrencies, metals, you name it.
2. I see “No Data Yet” in some cells—why?
The script needs at least one completed trading day for each weekday inside your selected Look-back Days window. If you choose a 10-day look-back and only two Mondays exist in that period, the Monday row will show “No Data Yet.” Increase the look-back or wait for more data to accumulate.
3. How often are the probabilities updated?
SRB recalculates on the close of every bar of the Calculation Timeframe you selected (15-minute by default). The heat-map table refreshes automatically—no manual reload is required.
4. Does SRB repaint past data?
No. All calculations are performed on fully closed candles, so historical percentages are fixed. The indicator never rewrites or adjusts past values.
5. How can I receive alerts on my phone or email?
After adding SRB to your chart, right-click the chart and choose Add Alert. Set Condition to SRB – Any alert, Frequency to Once Per Bar, and enable push or email in TradingView’s alert dialog. You’ll now get “Break Expected” and “Break Confirmed” notifications instantly.
6. Can I customize the session times?
Absolutely. Besides the built-in London, New York, and Asia presets, you can select Custom in the settings and define any start/end time in UTC.
Risk Disclaimer
“OrbitPips tools are provided for educational purposes only and do not constitute investment advice. Leveraged trading carries a high level of risk and may not be suitable for all investors. Past performance does not guarantee future results.”


)
David –
ii love it